The growth of mobile and the prevalence of personalization data has empowered the growth of proactive search systems, which push out information in a predictive fashion. While reactive search (user enters a query) remains the dominant aspect of search, platforms like Google Now and Microsoft Cortana are increasing the sophistication and frequency in which users interact with search in a predictive, query-less manner.
While much has been written about how users interact with traditional desktop search, and some has been written about how user interact with mobile search results, interactions with proactive search have not been as well-documented.
Microsoft conducted a study to determine how user behavior could be used to improve rankings and relevance in proactive platforms, which highlights a number of interesting takeaways about user behavior in these new ecosystems.
Where Users Find Proactive Search
The more dominant players in proactive search include Google Now, Apple Siri, and Microsoft Contra. All of these systems function in a similar fashion by providing proactive push notifications and informational cards without the user entering a query. These are triggered based on context, such as device, location, history, personal data, and aggregate non-personal trends.
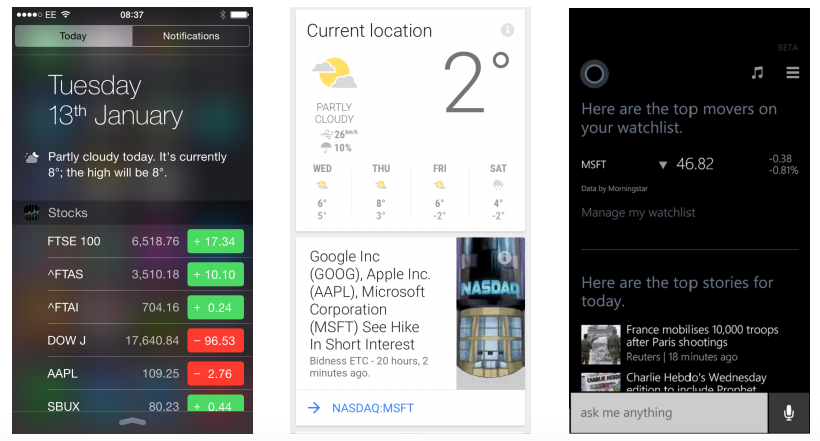
While these systems are in early stages of development, the concept of an “information card” is the most common and prevalent method for delivering proactive search information. They create a new form of SERPs and present a new model of search that marketers need to consider.
Information Card Terminology
As a new form of search results, there are some new concepts and vocabulary which differ from traditional search.
- JITIR (Just In-Time Information Retrieval) System – This is a system that proactively retrieves and displays information based on user context. The dominant context factors are time, location, and history.
- Information Cards – These are display mechanisms for chunks of proactive search information. They are typically designed as “cards” in apps and aggregate search results. They do not have to be clicked like a traditional search result to satisfy user intent. This introduces the need to track view behavior and identify “good abandonment”.
- Good Abandonment – When a card does not result in a click, but it does meet the user’s intent and satisfies the implicit query.
- Dwell Time – Degree of implicit interaction with user’s search and browse history, used to infer an explicit interaction. This can be combined with explicit historical behavior to improve personalization.
- Click Prediction – In order to model the click behavior of traditional search results, viewport-based metrics are used to infer card interactions and satisfaction. The viewport is tracked using Javascript (discussed in more detail here).
- Satisfied (SAT) Clicks – Clicks followed by a dwell time of 30 seconds.
- Proactive Search Impression – Cards are presented to a user (app is opened).
Information Card Click-Through Behavior
Looking at aggregate views and “clicks” (SAT-Clicks) by rank position shows a very top-heavy ecosystem (graph normalizes values by setting them all relative to the first position).
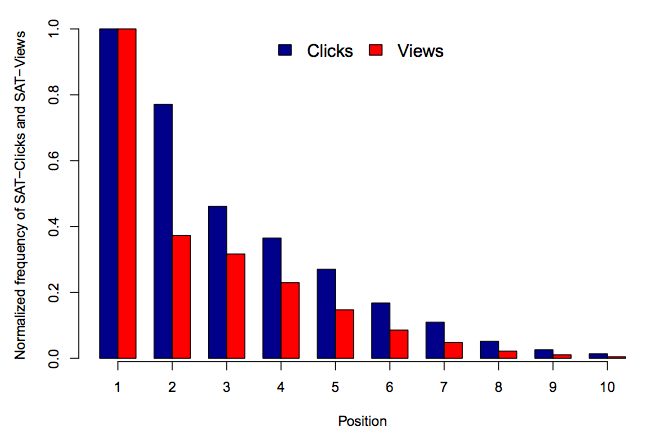
Similar to traditional desktop search, there is a significant drop in attention as a user moves down the search results. Cards in lower rank positions get very little attention.
The #1 result dominates user attention, with 60% fewer views making it to position #2 compared to position #1. While view is top heavy, click distribution is a bit more linear in nature (still top heavy, but doesn’t drop off as quickly). For clicks, the #2 position gets about 80% as many of the clicks as the #1 position.
Differences by Context
Just as with traditional search, queries and device usage on predictive search changes by context, such as being at work, traveling, or being at home on the weekend. There are some very similar assumptions that can be made about how users engage with proactive search in these various contexts.
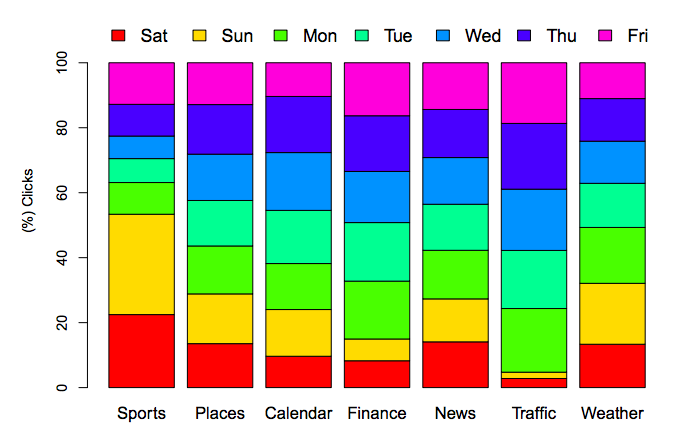
Looking across card categories by the day of the week, the effect of the traditional work week can be seen. On week days, users are more likely to engage with traffic, finance, and calendar. On weekends, users are more likely to engage with sports, weather, and places. These follow expected behavioral changes based on day-of-week context changes.
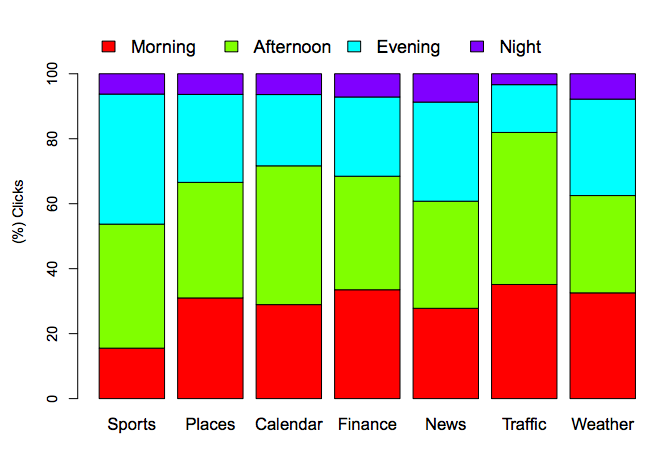
In a similar fashion, category-level interactions change by time of day. Here, we see that users engage with traffic and finance in the morning, news and sports in the evening, and calendar and traffic in the afternoon.
These queries show the temporal nature of user location, which typically revolves around home and work.
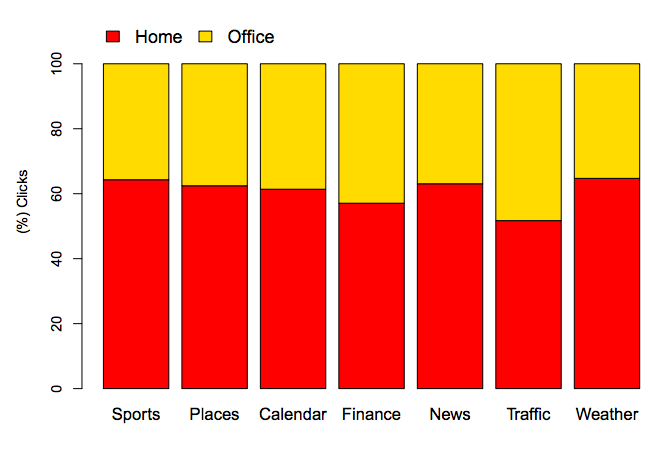
Except for finance and traffic, two-thirds of clicks take place at home, and one-third of clicks take place at the office. The data reinforces the assumption that mobile is a dominant home device and desktop is a dominant workplace device.
Reoccurring Usage of Predictive Search
Looking at the temporal gap between interactions (time between subsequent engagements), there are some interesting takeaways.
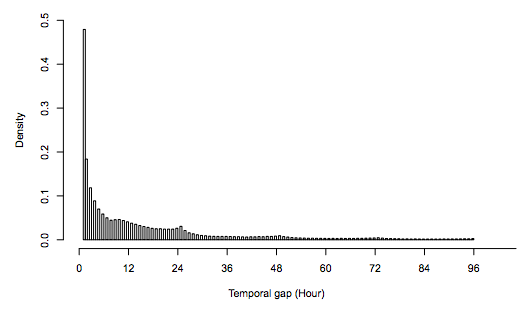
The data suggests that once a user clicks on a card, the next click is most likely to appear within an hour. Spikes are also seen around 24, 48, and 72 hours, which suggests that many users engage with the cards at the same time of day.
Overall usage data suggests that users are engaging with proactive search in a regular and predictable fashion, with behaviors similar to what have been seen in traditional search.
Driving Traffic to Documents
While not all information cards generate a true “click,” several cards, such as sports, news, and places, can send traffic to web documents. When looking at this behavior, its important to split out Desktop Reactive and Mobile Reactive searches (user enters a query) to ensure that differences due to device are spotted.
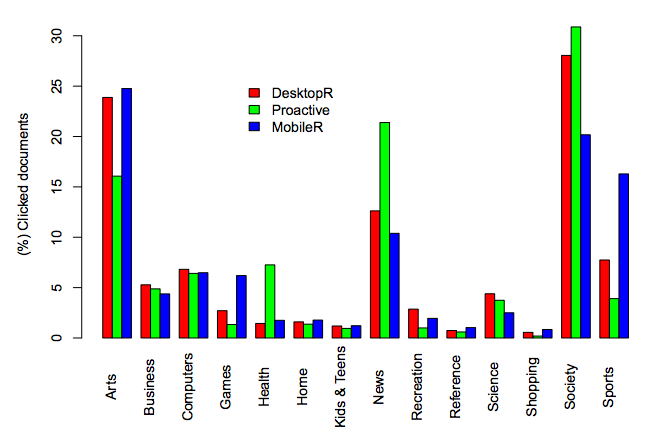
Looking at the device differences for DesktopR and MobileR (reactive search), it is clear that games and sports heavily skew mobile, while society, science, news, and business skew desktop. Proactive search engagement is over represented in areas such as news, society, and health.
A user’s cross-platform behavior can be demonstrated by overlapping their engagements by category on both mobile reactive and desktop reactive with their engagement with proactive search. This overlap is shown in the heat maps below.

A lot of data is shown here, but, in short, it demonstrates an overlap in interests (as seen in the diagonal density). This means that users typically interact with the same topics / content types on both mobile and desktop, for both reactive and proactive search. This also means that a user’s reactive search behavior could be predictive of what content they may engage with in predictive search.
Tactical Takeaways
There are some key takeaways we can keep in mind when looking at search opportunities associated with Google Now and other predictive search platforms. These give insight on how businesses should prioritize opportunities associated with this growing area of search.
- It’s a “winner takes most” ecosystem – The platform is top-heavy, so unless you feel you can dominate a category for your users, there is not yet a lot of visibility to be earned at lower ranks.
- It’s mobile-focused – If your audience doesn’t skew mobile, it’s not as valuable of an opportunity.
- It’s home focused – Weekend, evening, and home searches dominate behavior. This suggests predictive search is more of a B2C than a B2B opportunity.
- Not all topics are created equal – Some verticals will benefit a lot more from predictive search than others in the short-term.
- Reactive insights can inform predictive strategy – What you know about your users in traditional search can be applied to predictive search with some degree of confidence, assuming you’re accounting for device differences.
- Valuable for reoccurring engagements products / brands – If your customers engage with you / your product on a regular basis, predictive search opportunities might be a good investment.
- Publish and market strategically – Understand user consumption behaviors that vary by context and change your publishing and marketing strategies to mirror that behavior.
